| <Previous | 1 | 2 | 3 | 4 | 5 | 6 | 7 | 8 | 9 | 10 | Next> |

View this screenshot on Mac
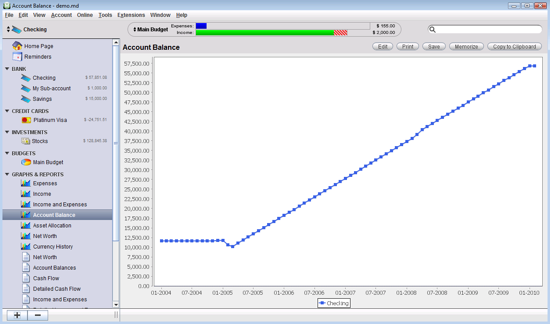
| Account Graphing. Use the graphing tool to generate visual reports of your income and expenses. Set the graph type, the date range, and any specific settings for the type of graph you desire. Pop-up balloons display more information about the data being graphed as you move the mouse pointer over different regions of the screen. Graphs can also be printed or saved to image (GIF) files. |
| Next > |


